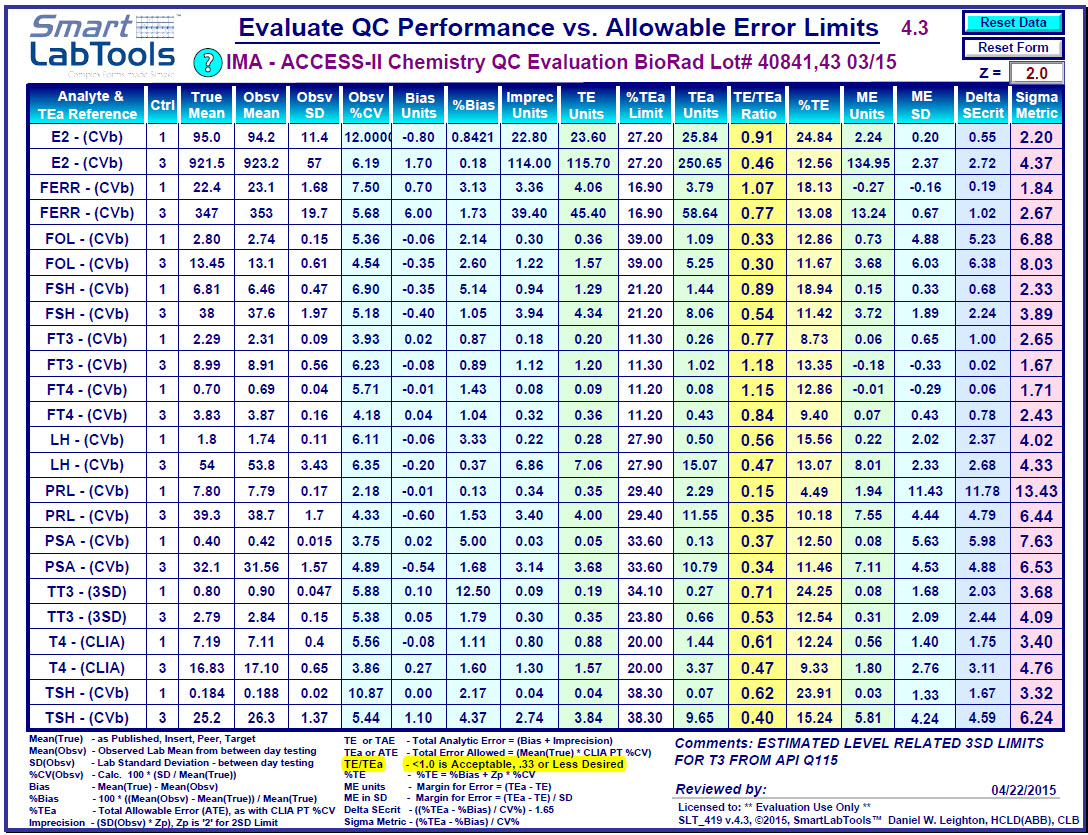
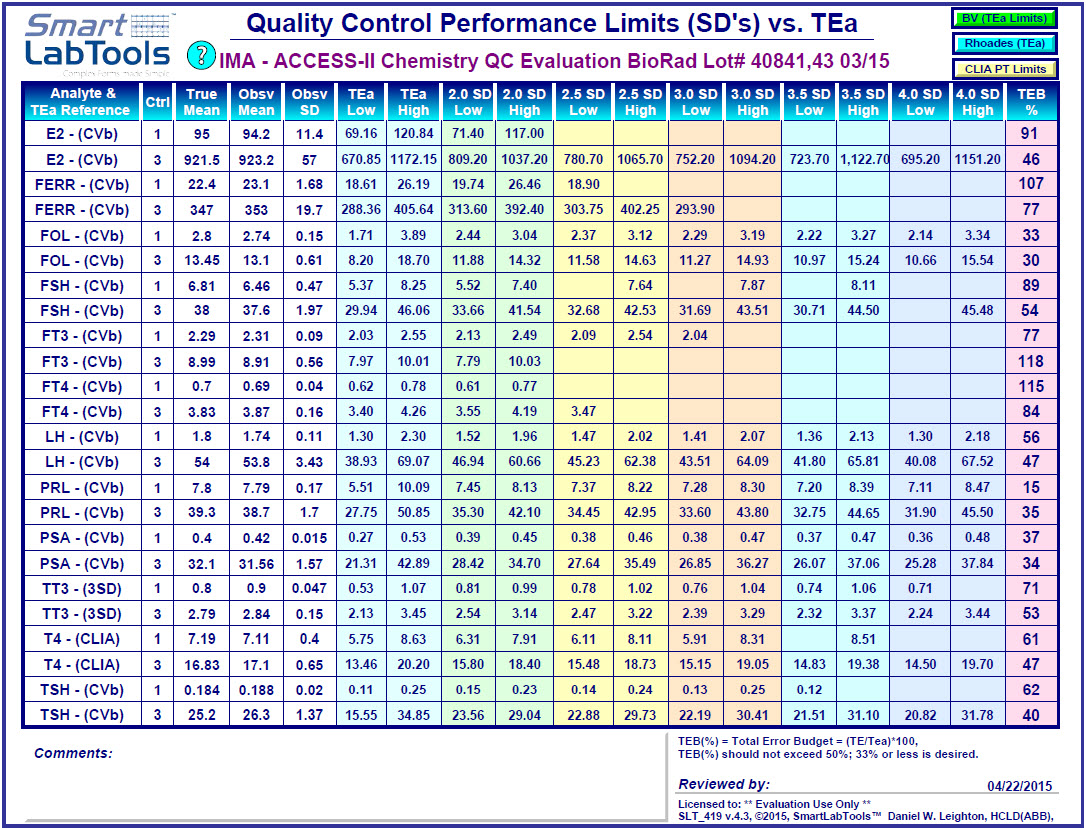
This 2-page SmartLabTool performs the calculations that assist the design of QC procedures, and the routine monitoring of methods and instruments.
Compares QC total error to allowable error limits.
Simplifies calculations for:
- Bias and imprecision (%Bias), (%CV)
- Total error
- TE/TEa ratio
- Total error budget
- Margin for error
- Sigma metric
- QC limits
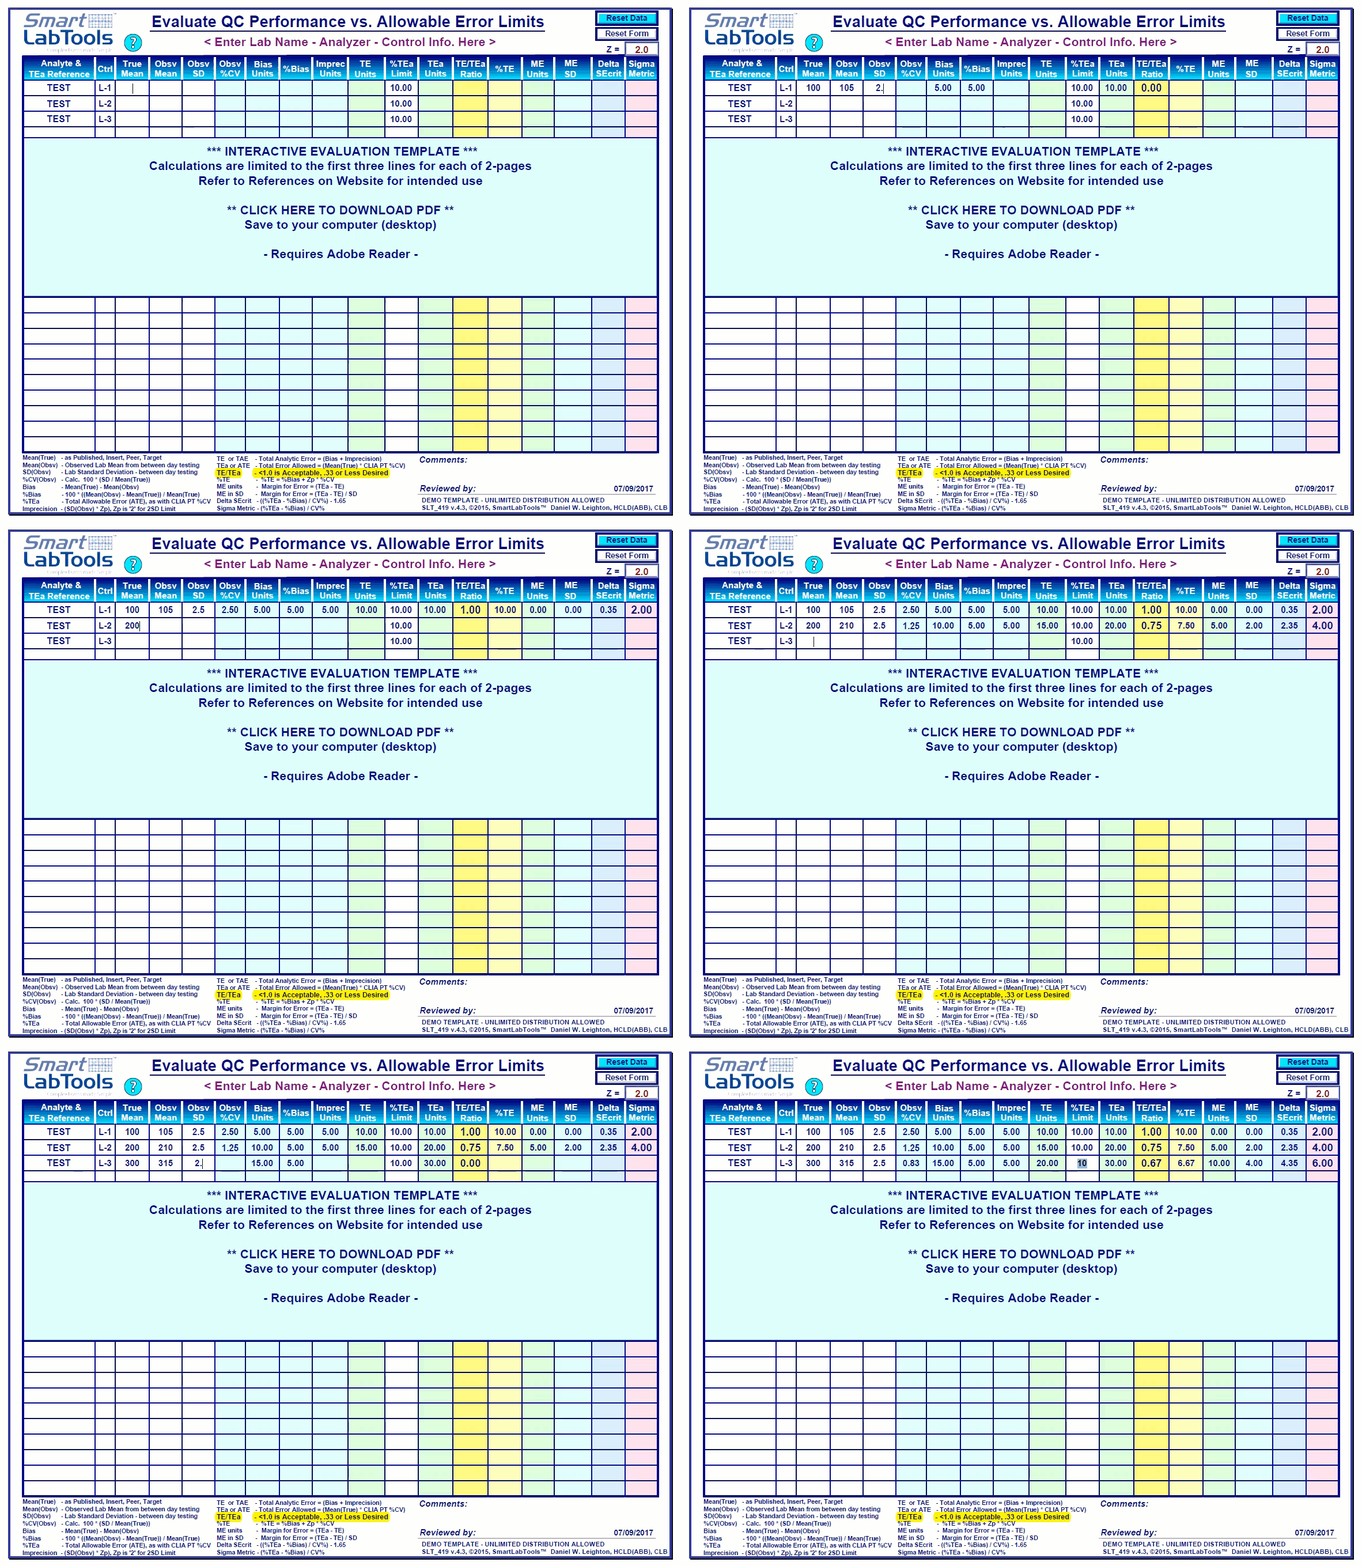
User enters the information in the white columns:
Analyte, Source for TEa limits, Control Level, True Mean, Observed Mean and SD, TEa limit (%).
Calculations happen automatically on both pages (actual user month-end statistics were used in these example images).
Links are provided to TEa limit references.
User may [Save] the Template for re-use.
[Reset Data] preserves the Analyte descriptions and TE%, while clearing lab statistics and calculations.
References and Resources
Risk Assessment: QC Metrics Made Easy
Daniel W. Leighton, Bioanalyst
Quantitating Quality: Best Practices for Estimating the Sigma-metric
Sten Westgard, MS
Six Sigma Metric Analysis for Analytical Testing Processes
Sten Westgard, MS
Westgard Website - "Westgard Rules"
Sigma Matters: Transforming Lab Quality Using Six Sigma, Informatics, and Moving Averages
AACC 2015 (YouTube)
Click on images to view forms


